Zaeim Eusoff

Final year Data Science Student at Universiti Malaya
List of Projects
1. Sea Level Predictor - View on GitHub
Employed Pandas for dataset extraction and matplotlib for data visualization, I analyzed the global average sea level change since 1880. Utilizing the linregress function from scipy.stats, I predicted the sea level change through the year 2050. The project included tasks such as creating a scatter plot, plotting the line of best fit, and forecasting the sea level rise in 2050. Unit tests were integrated to ensure accuracy and reliability.
2. Page View Time Series Visualizer - View on GitHub
Developed a data visualization project using Python, Pandas, Matplotlib, and Seaborn to analyze time series data from freeCodeCamp.org’s forum. Utilized Pandas to import and clean the dataset, filtering out extreme values. Implemented a line chart to visualize daily page views from 2016-05-09 to 2019-12-03, allowing for a comprehensive understanding of growth patterns. Additionally, created a bar chart to illustrate monthly page views grouped by year, providing insights into monthly trends. Leveraged Seaborn to construct comparative box plots, showcasing the distribution of values across different years and months, aiding in the identification of yearly trends and seasonal variations.
3. Medical Data Visualizer - View on GitHub
Implemented data visualization and analysis on medical examination data utilizing matplotlib, seaborn, and pandas. The project involved exploring the relationship between cardiovascular disease, body measurements, blood markers, and lifestyle choices. Additionally, data preprocessing tasks such as adding an “overweight” column, data normalization, and cleaning were performed. A correlation matrix was generated to illustrate the interrelationships between different variables in the dataset.
4. Demographic Data Analyzer - View on GitHub
Data analysis on a demographic data extracted from the 1994 Census database using Pandas.
The analysis answer the following questions:
- How many people of each race are represented in this dataset?
- What is the average age of men?
- What is the percentage of people who have a Bachelor’s degree?
- What percentage of people with advanced education (Bachelors, Masters, or Doctorate) make more than 50K?
- What percentage of people without advanced education make more than 50K?
- What is the minimum number of hours a person works per week?
- What percentage of the people who work the minimum number of hours per week have a salary of more than 50K?
- What country has the highest percentage of people that earn >50K and what is that percentage?
- Identify the most popular occupation for those who earn >50K in India.
5. Mean-Variance-Standard Deviation Calculator - View on GitHub
Python function that uses Numpy to output the mean, variance, standard deviation, max, min, and sum of the rows, columns, and elements in a 3 x 3 matrix.
The input of the function should be a list containing 9 digits. The function should convert the list into a 3 x 3 Numpy array, and then return a dictionary containing the mean, variance, standard deviation, max, min, and sum along both axes and for the flattened matrix.
6. Data Analysis : Maternity Mental Health Care - View on GitHub
This data analysis project conducted to identify the factor(s) that contribute to mental health issues in peripartum women. Then we develop a prediction model for the early detection of maternal mental health issues. We used 3 machine learning algorithm(logistic regression, decision tree, and random forest) and we do a comparative analysis to compare and rank them based on their accuracy. For this project we carried out using Python, BigML, and SPSS Modelor to explore different approaches in handling the problem statement.
7. Data Analysis : Predicting Student Dropout Rates in Higher Education - View on GitHub
This data analysis project conducted to identify the factors that contribute to student dropout rates in higher education and understand the correlation between the attributes better. Then we develop a predictive model that can identify students at risk of dropping out. The project is carried out using Python and R.
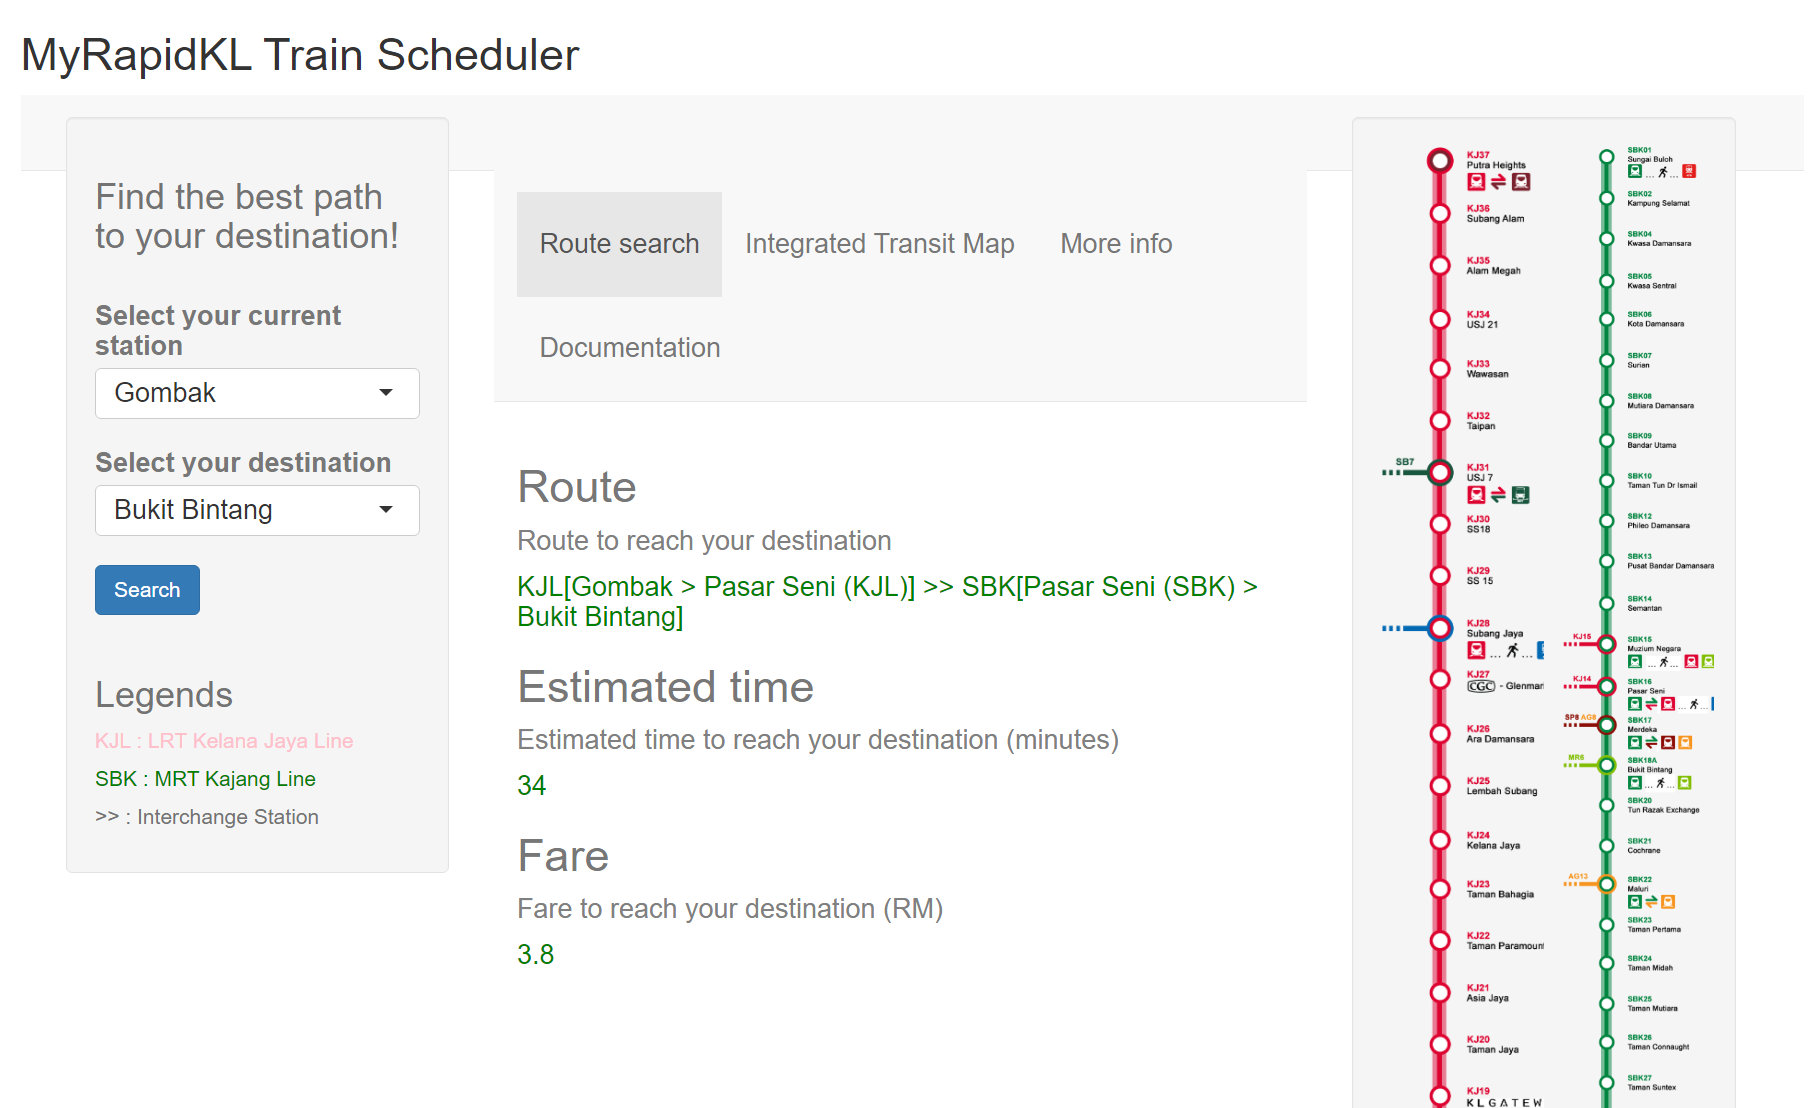
8. My RapidKL Train Scheduler - View on GitHub
A Shiny App named My RapidKL Train Scheduler which are useful for train journey planning Users can :
- Select current location and destination.
- Search for route,route fare and estimated time to reach destination.
- View the documentation and extra information of RapidKL Services.